AHVVA Interactive Results
The results of an AHVVA assessment will be sent to the selected reviewing contact via email as a link. The email will look like this:
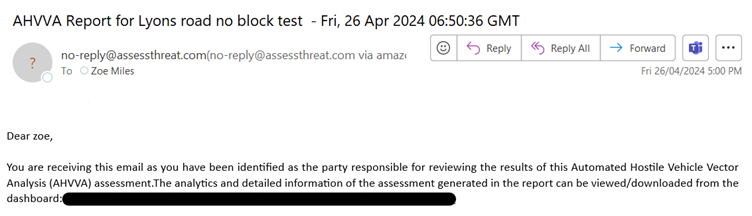
Please note that the link has been redacted from the image above.#
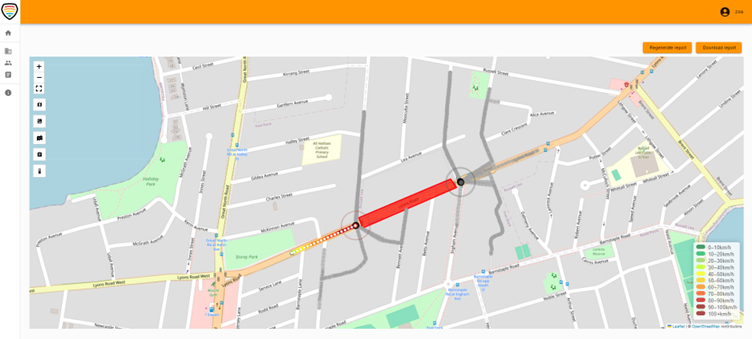
The link provided will open an interactive map where users can explore the results of the analysis in detail. From this interactive map, users can also generate a PDF report.
View Analysis#
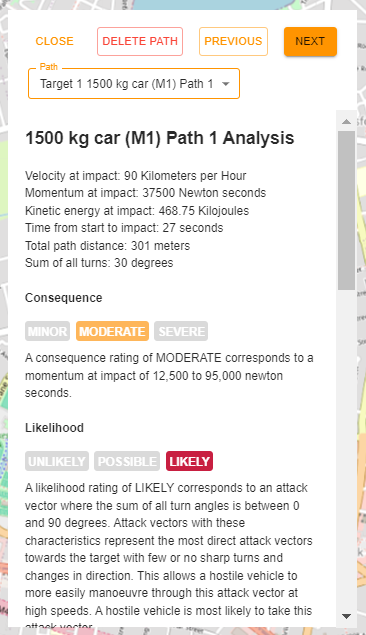
Clicking this will open the analysis window for the selected path.
The analysis window contains information including:
- Velocity at impact
- Momentum at impact
- Kinetic energy at impact
- Time from start to impact
- Consequence rating
- Likelihood rating
- Overall risk rating
- Comments
- Graph of velocity over distance of the path
- Graph of kinetic energy over distance of the path
- Graph of elevation over distance of the path
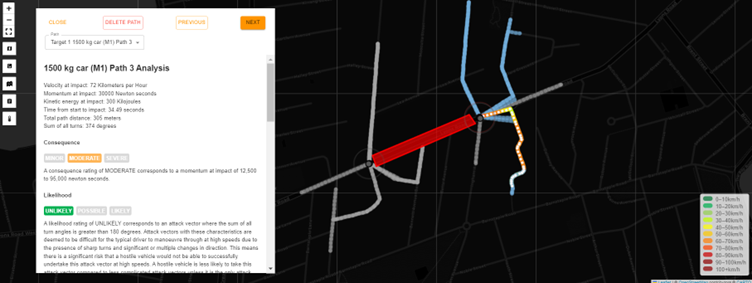
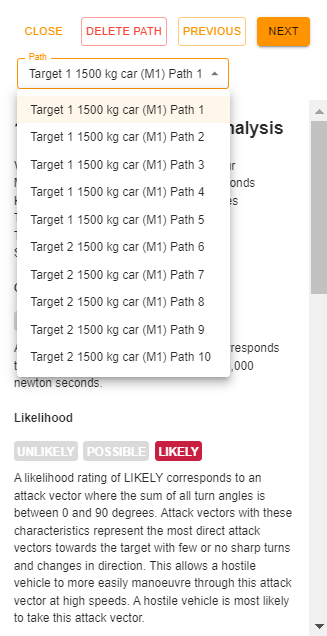
Selecting Different Paths#
You can scroll between the paths by either pressing "PREVIOUS" or "NEXT" in the analysis dialog:
Or by using the path dropdown menu. Click on "Path" and then select a target, vehicle type and path from the provided list.
Inspecting Points in the Path#
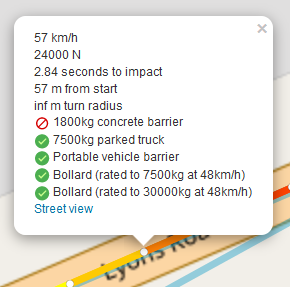
You can inspect individual points in the path by hovering your mouse over the white dots along the path. When you hover over one of these points, a popup will appear providing information specific to that point in the path:
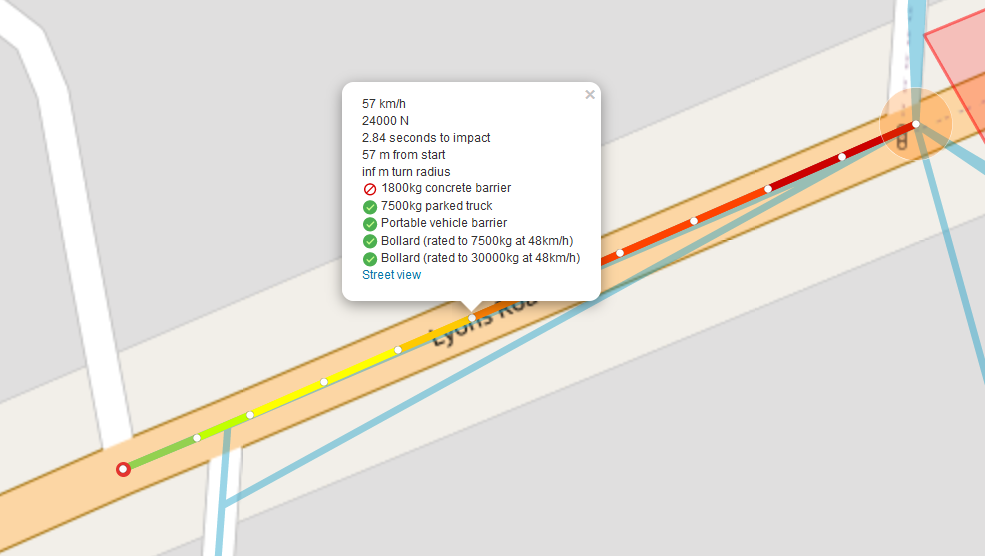
This popup will display the speed of the vehicle at that point in the path, the energy of the vehicle, the seconds to impact, the distance from the starting point, and the turn radius measurement.
It will also display a checklist with 5 standard types of barriers. There will be a tick next to barriers estimated to be effective, and a cross next to barrier types estimated to be not effective.
warning
The effectiveness ratings are an estimate only, based on the kinetic energy of the vehicle at that point. There are many other factors which may affect the effectiveness of a barrier and further consultation should be sought if more detailed and precise information is required.
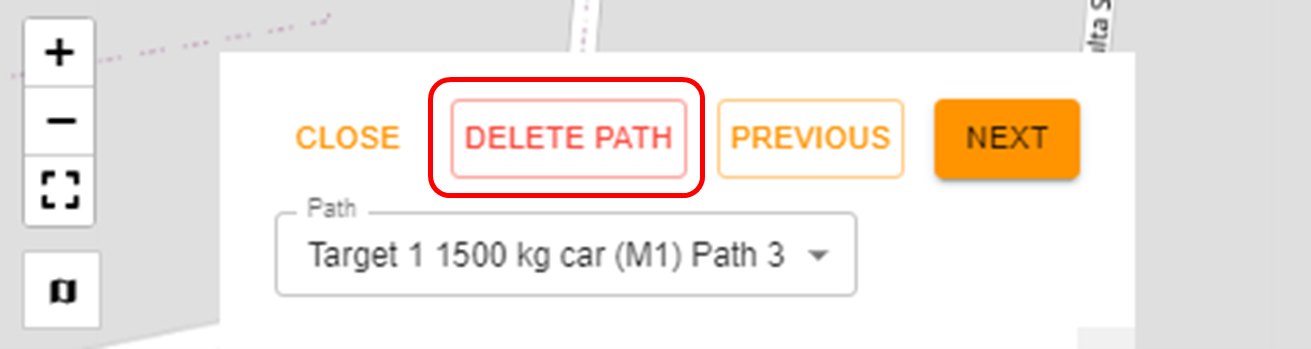
Deleting a Path#
You may wish to manually remove certain paths from the analysis results. This could be due to duplication in the paths, issues with some of the paths the algorithm has identified, or to narrow down the specific paths presented in the results.
To remove a path from the results, click on the "view analysis" button to bring up the menu dialog for that path.
Then click the "delete path" button:
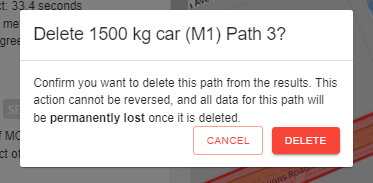
Confirm that you want to delete the path:
The path will now be removed from the results. It will not be included in any report generated as well.
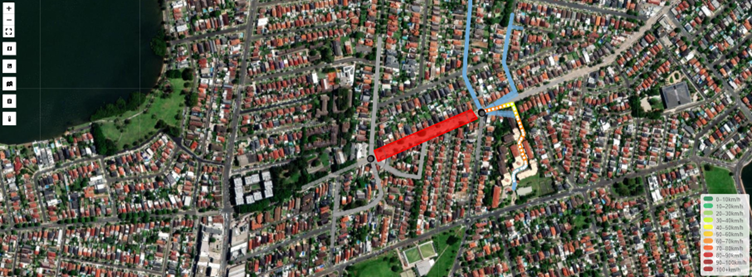
Satellite View#
Changes the base layer map to a satellite image map.
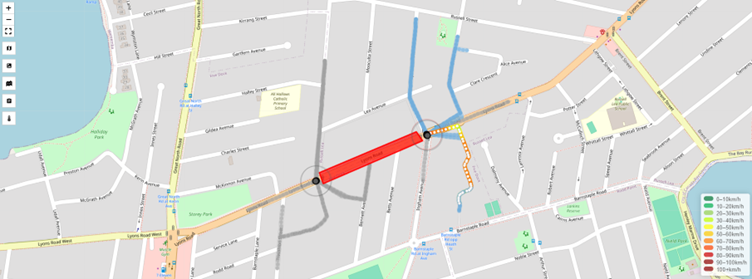
Road Map View#
Changes the base layer map to a road map.
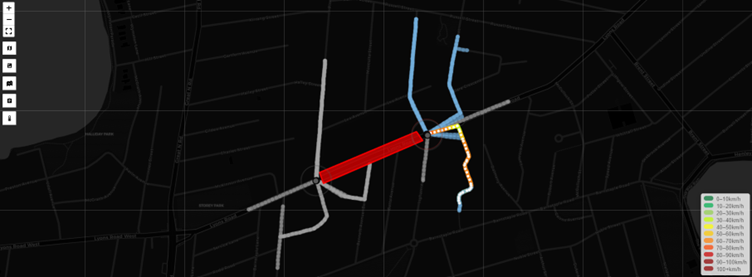
Dark View#
Changes the base map layer to a dark map. This works well to highlight paths and with the heatmap.
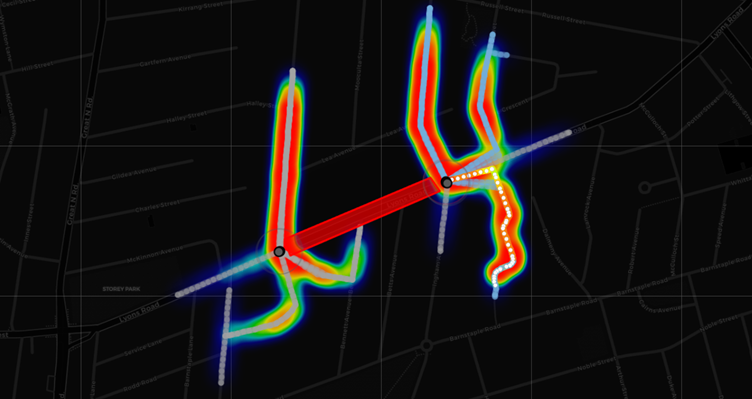
Heatmap#
The Heatmap is an experimental feature that measures the kinetic energy of all points in all paths analysed in the assessment. It will include all paths that were analysed, and not just those that were returned to the use.
The areas of high "heat" represent" areas where the average kinetic energy of a vehicle across all paths analysed was high.
Regenerate and Download the AHVVA Report#
To regenerate the AHVVA report, simply click on “REGENERATE REPORT” located in the top right corner above the interactive results map. This action enables you to recreate or update the analysis and report using the most recent data or settings. It’s necessary to regenerate the report whenever changes, such as path deletions, are made to the AHVVA analysis so that the changes are reflected in the PDF report.
warning
On average it takes 15-30 minutes for the report to be generated. However, the greater the number of paths and vehicles in your assessment, the longer the report will take to generate.
To download the AHVVA PDF report, click "DOWNLOAD REPORT" in the top right above the interactive results map.
[Input image]
Once clicked, a PDF report will be automatically downloaded to your device.
[Input image]