Guide to the AHVVA Report
From the interactive results map and the Portal Homepage, you can generate a PDF report of the analysis. The PDF report will look like this:
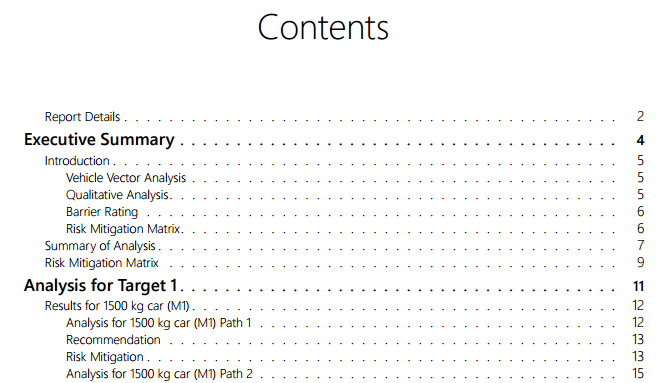
The report is split into multiple parts: the first part will be an Executive Summary of all the results, and then each target will have its own dedicated section.
Executive Summary#
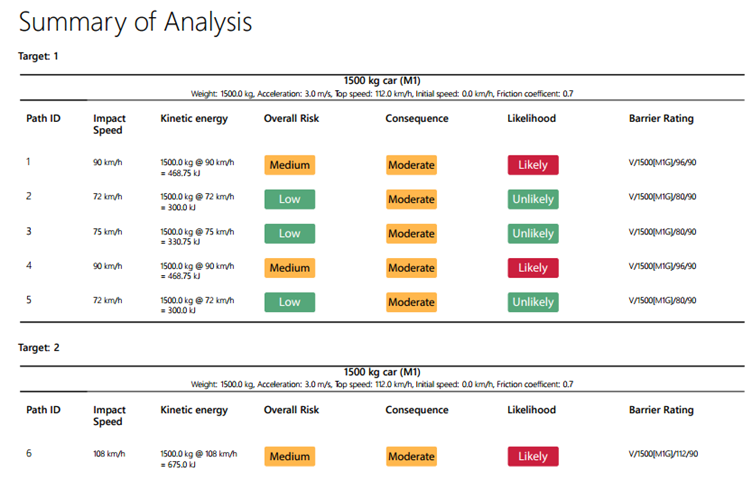
Summary of Analysis Table#
The Summary of Analysis table provides a summary of all the top-level findings for each path including:
- Speed at impact
- Kinetic energy at impact
- Overall risk
- Consequence
- Likelihood
- Barrier rating
note
See qualitative assessment method to understand how the overall risk, consequence, likelihood and barrier rating values are determined.
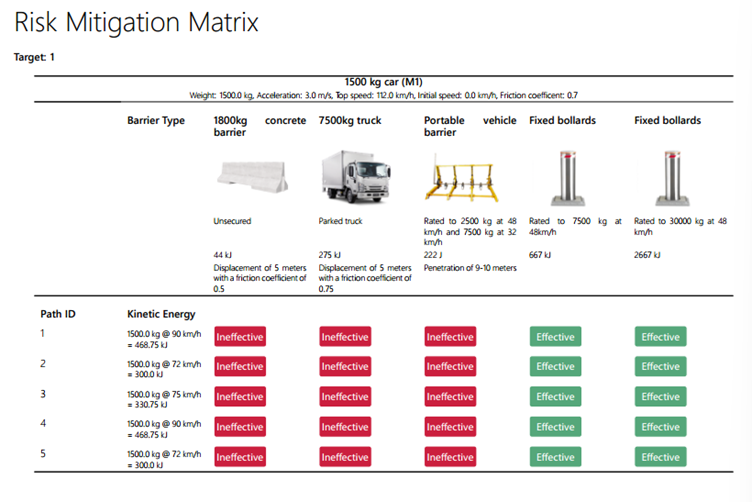
Risk Mitigation Matrix#
warning
This is an experimental feature and only estimates effectiveness based on a comparison of the kinetic energy required to displace a barrier, or the kinetic energy corresponding to the rating of the barrier. There are many factors which can influence the effectiveness of a barrier and these results should only be used as a rough guide.
The risk mitigation matrix performs a comparison of the kinetic energy at impact, to the kinetic energy rating of various barriers. The kinetic energy rating of the various barriers is displayed on the top row of the table. For unrated barriers such as the concrete barrier and parked truck, the kinetic energy rating is obtained by calculating the amount of energy required to displace those objects a certain distance, assuming a certain friction coefficient. For rated barriers, the kinetic energy rating is obtained by calculating the kinetic energy of the barrier rating i.e. rated to 7500kg at 48km/h corresponds to 667Kj.
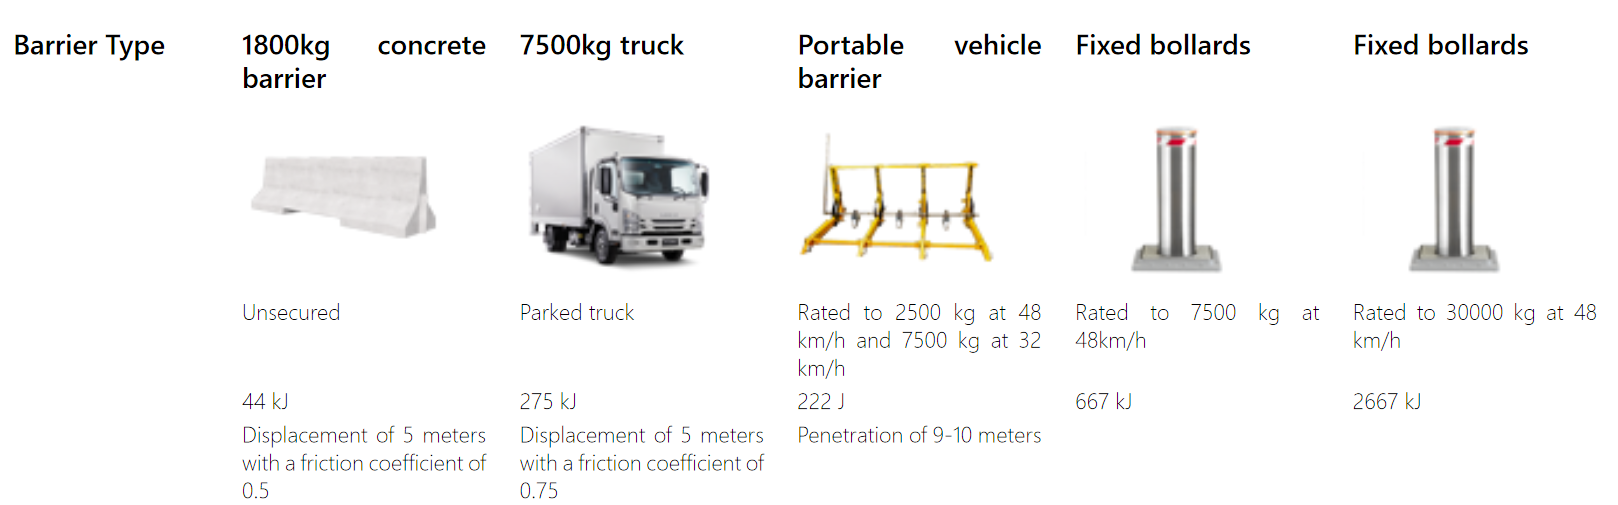
Where the kinetic energy of the vehicle at impact exceeds the kinetic energy rating of the barrier, it is labelled as potentially ineffective.
This table is intended to provide a rough estimate of the potential effectiveness of various barrier types, rated and unrated. It should however not be used as a definitive guide to what barriers would be effective or ineffective.
Target Analysis#
Each target has its own section in the report. The analysis inside a target section is grouped by vehicle type and then path number e.g. 1500 kg car (M1) Path 1.
Path Analysis#
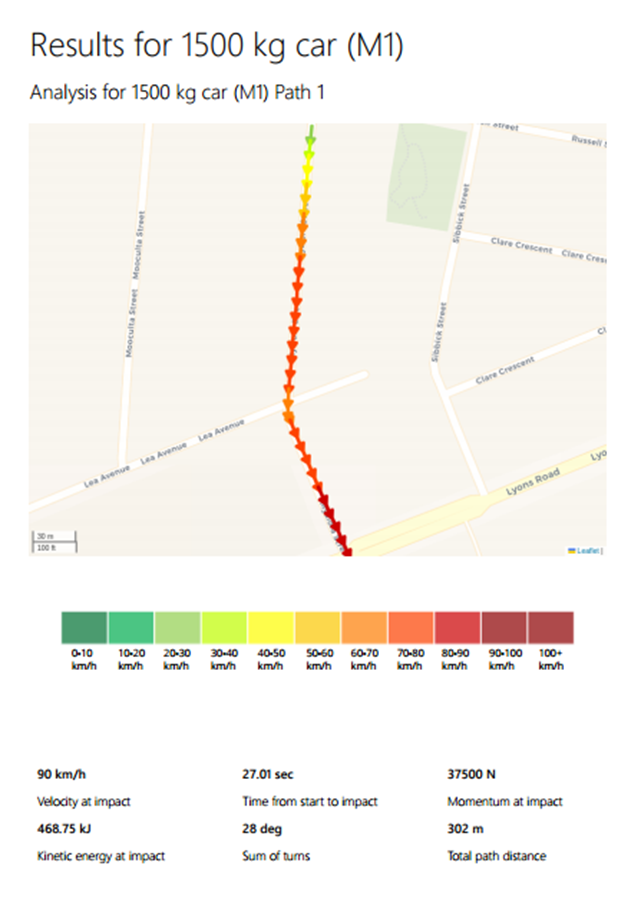
Each path will have 3 pages of analysis including a map with the path plotted, and a summary of all the main data points below it such as the velocity at impact, time from start to impact, total path distance and so on.
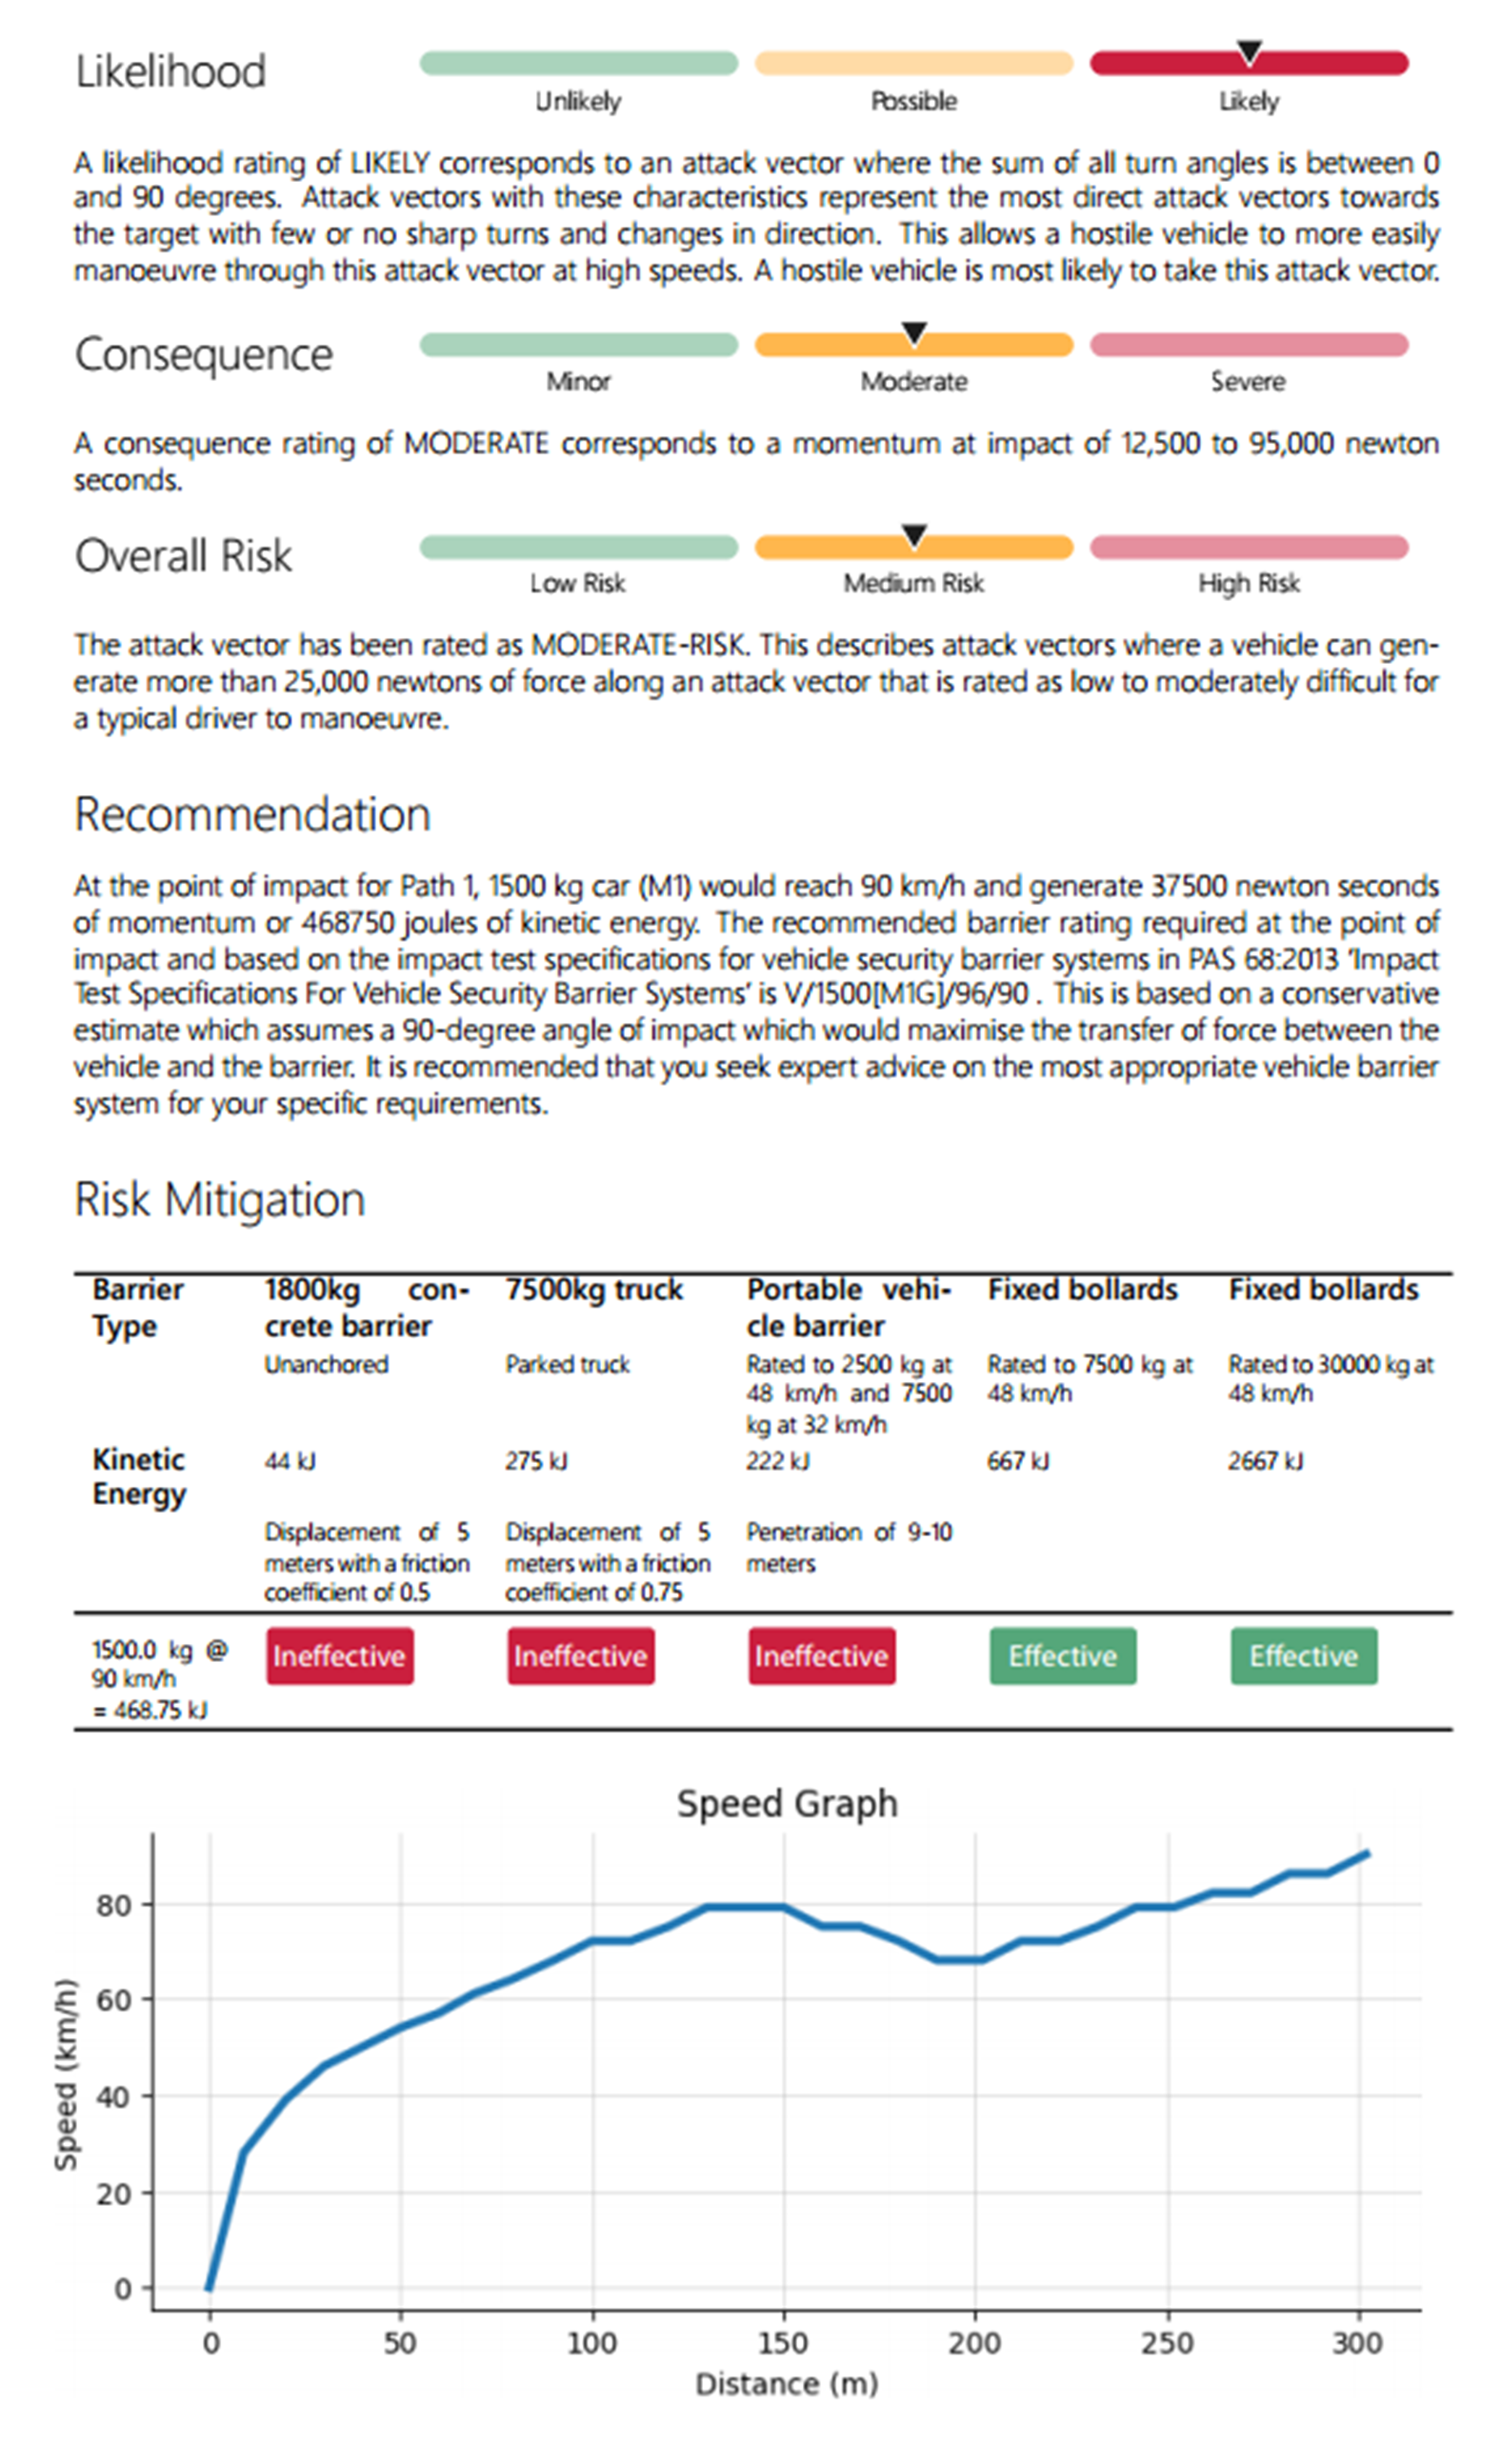
It will also contain the likelihood, consequence and overall risk rating, recommendation, a risk mitigation matrix specific to the individual path, and then a graph of the speed of the vehicle across the distance of the path.
Qualitative Assessment Method#
The following section outlines the methodology for the qualitative assessment used throughout AHVVA to ascertain likelihood, consequence and overall risk.
note
The parameters for the qualitative assessment are intended to act as a guide to understanding the quantitative data and results produced by the product. As such, these parameters may be adjusted to accommodate specific user needs or local requirements.
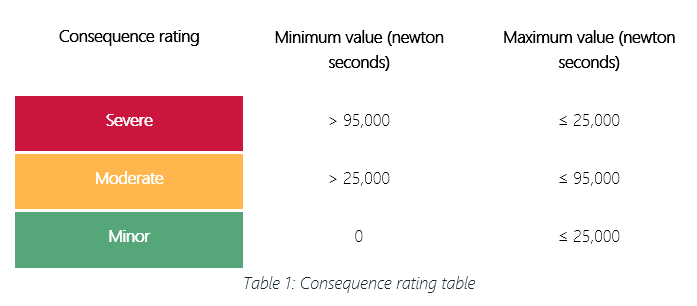
Consequence#
Consequence is defined as a measurement of the impact of an event. In the case of AHVVA, it is based on momentum of the vehicle being assessed at the point of impact, which itself is a function of the velocity that the vehicle is travelling and its mass. There are 3 qualitative consequence ratings.
Likelihood#
Likelihood is defined as a measurement of the relative probability that an event will occur. In the case of AHVVA, it is based on an analysis of the difficulty of the path measured via the sum of the angle of turns for a path. The principle here is that the more complex and difficult a path is to navigate due to high number of sharp turns or changes in direction, the lower the likelihood that the path will be used or taken relative to other simpler and less challenging paths. There are 3 qualitative likelihood ratings.

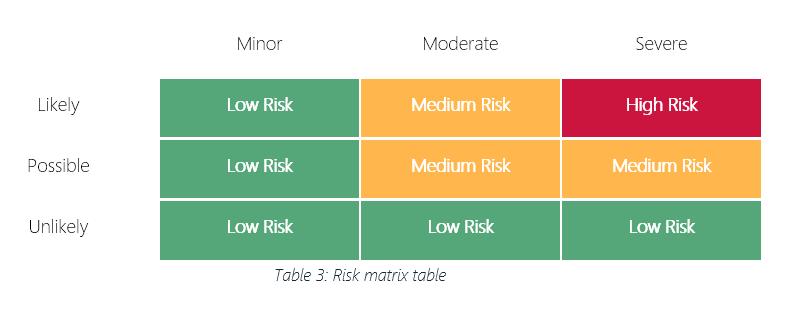
Overall Risk Rating#
The overall risk rating is determined by the consequence and likelihood rating as the two axes of a 3x3 risk matrix.
Barrier ratings recommendation#
This is a prototype feature intended to provide a basic matching of the calculations performed by AHVVA to vehicle barrier testing standards and ratings set out in IWA 14-1:2013. This feature should be used as a general guide only, and it should not be used as the basis for selecting barrier products or measures without further consultation from an engineering professional. This is because the selection of barriers requires many different factors to be considered beyond just the calculation of the maximum possible speed attainable by a vehicle. For example, the type of surface, underground utilities, and emergency access requirements all factor into the selection of an appropriate barrier.
The format of the ratings recommendation is as follows:
The maximum speed reached by the vehicle is {maximum speed in km/h} which is achieved at {distance where the maximum speed is attained} meters from the starting point. To effectively stop a vehicle weighing {weight of the vehicle} and traveling at {maximum speed in km/h} requires a barrier rated to {barrier rating} or greater. This is based on a conservative estimate which assumes a 90-degree angle of impact which would maximise the transfer of force between the vehicle and the barrier.
The barrier rating is provided in the following format as specified in IWA 14-1:2013. Note however that the vehicle penetration value is not provided in the rating as this cannot be determined by AHVVA based on the information available to it.
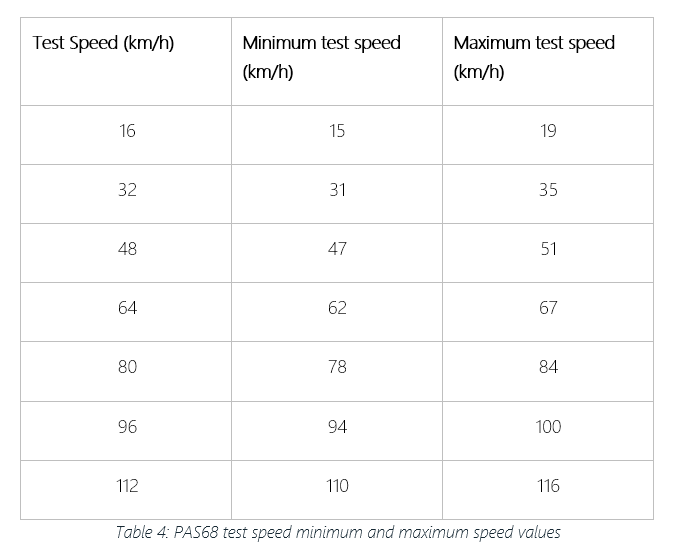
Test type (V)/Vehicle mass (kg) [Vehicle abbreviation]/Test Speed (km/h)/Impact angle (°): vehicle penetration (m)
The value for the Test Speed is determined according to where the velocity at impact falls according to the test speed and test speed ranges described in the table below. Where a velocity at impact falls between two Test Speed values, the higher Test Speed value will be selected. For example, if the velocity at impact is 40 km/h which sits between the two Test Speeds 32km/h and 48 km/h, then the Test Speed value will be 48 km/h.